qPharmetra
Transforming abstract capabilities into a story
From data to story
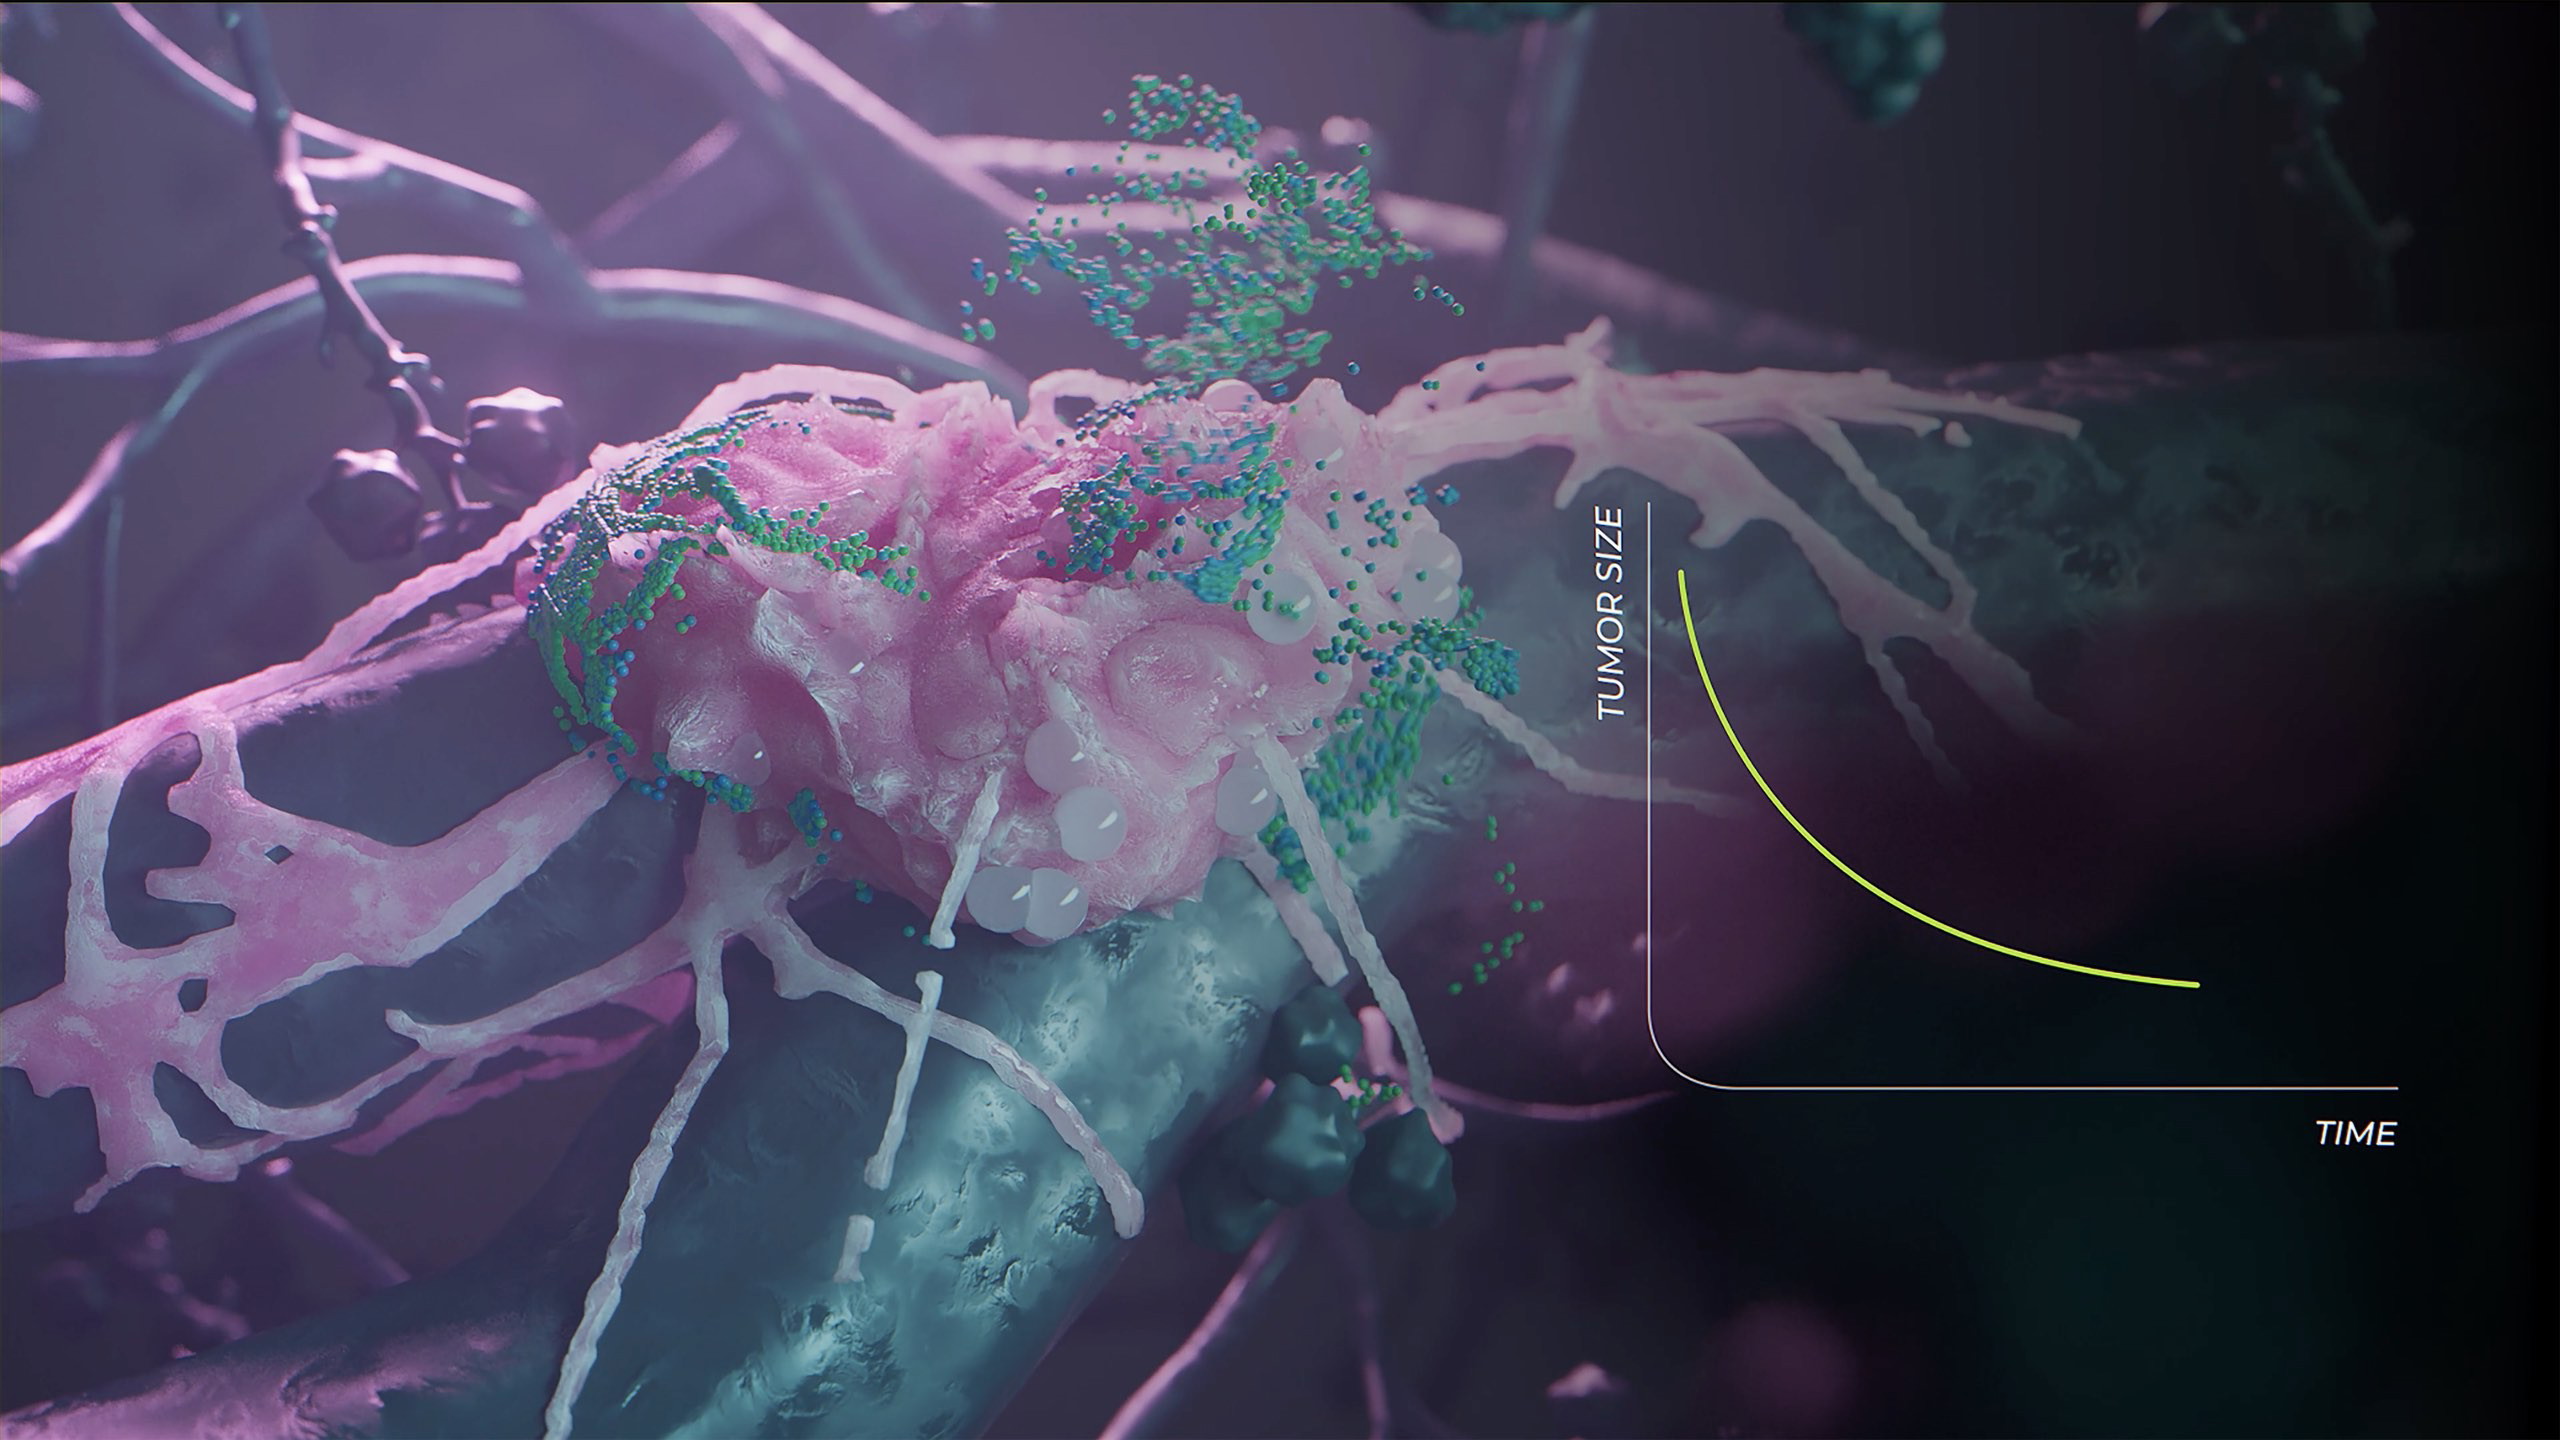
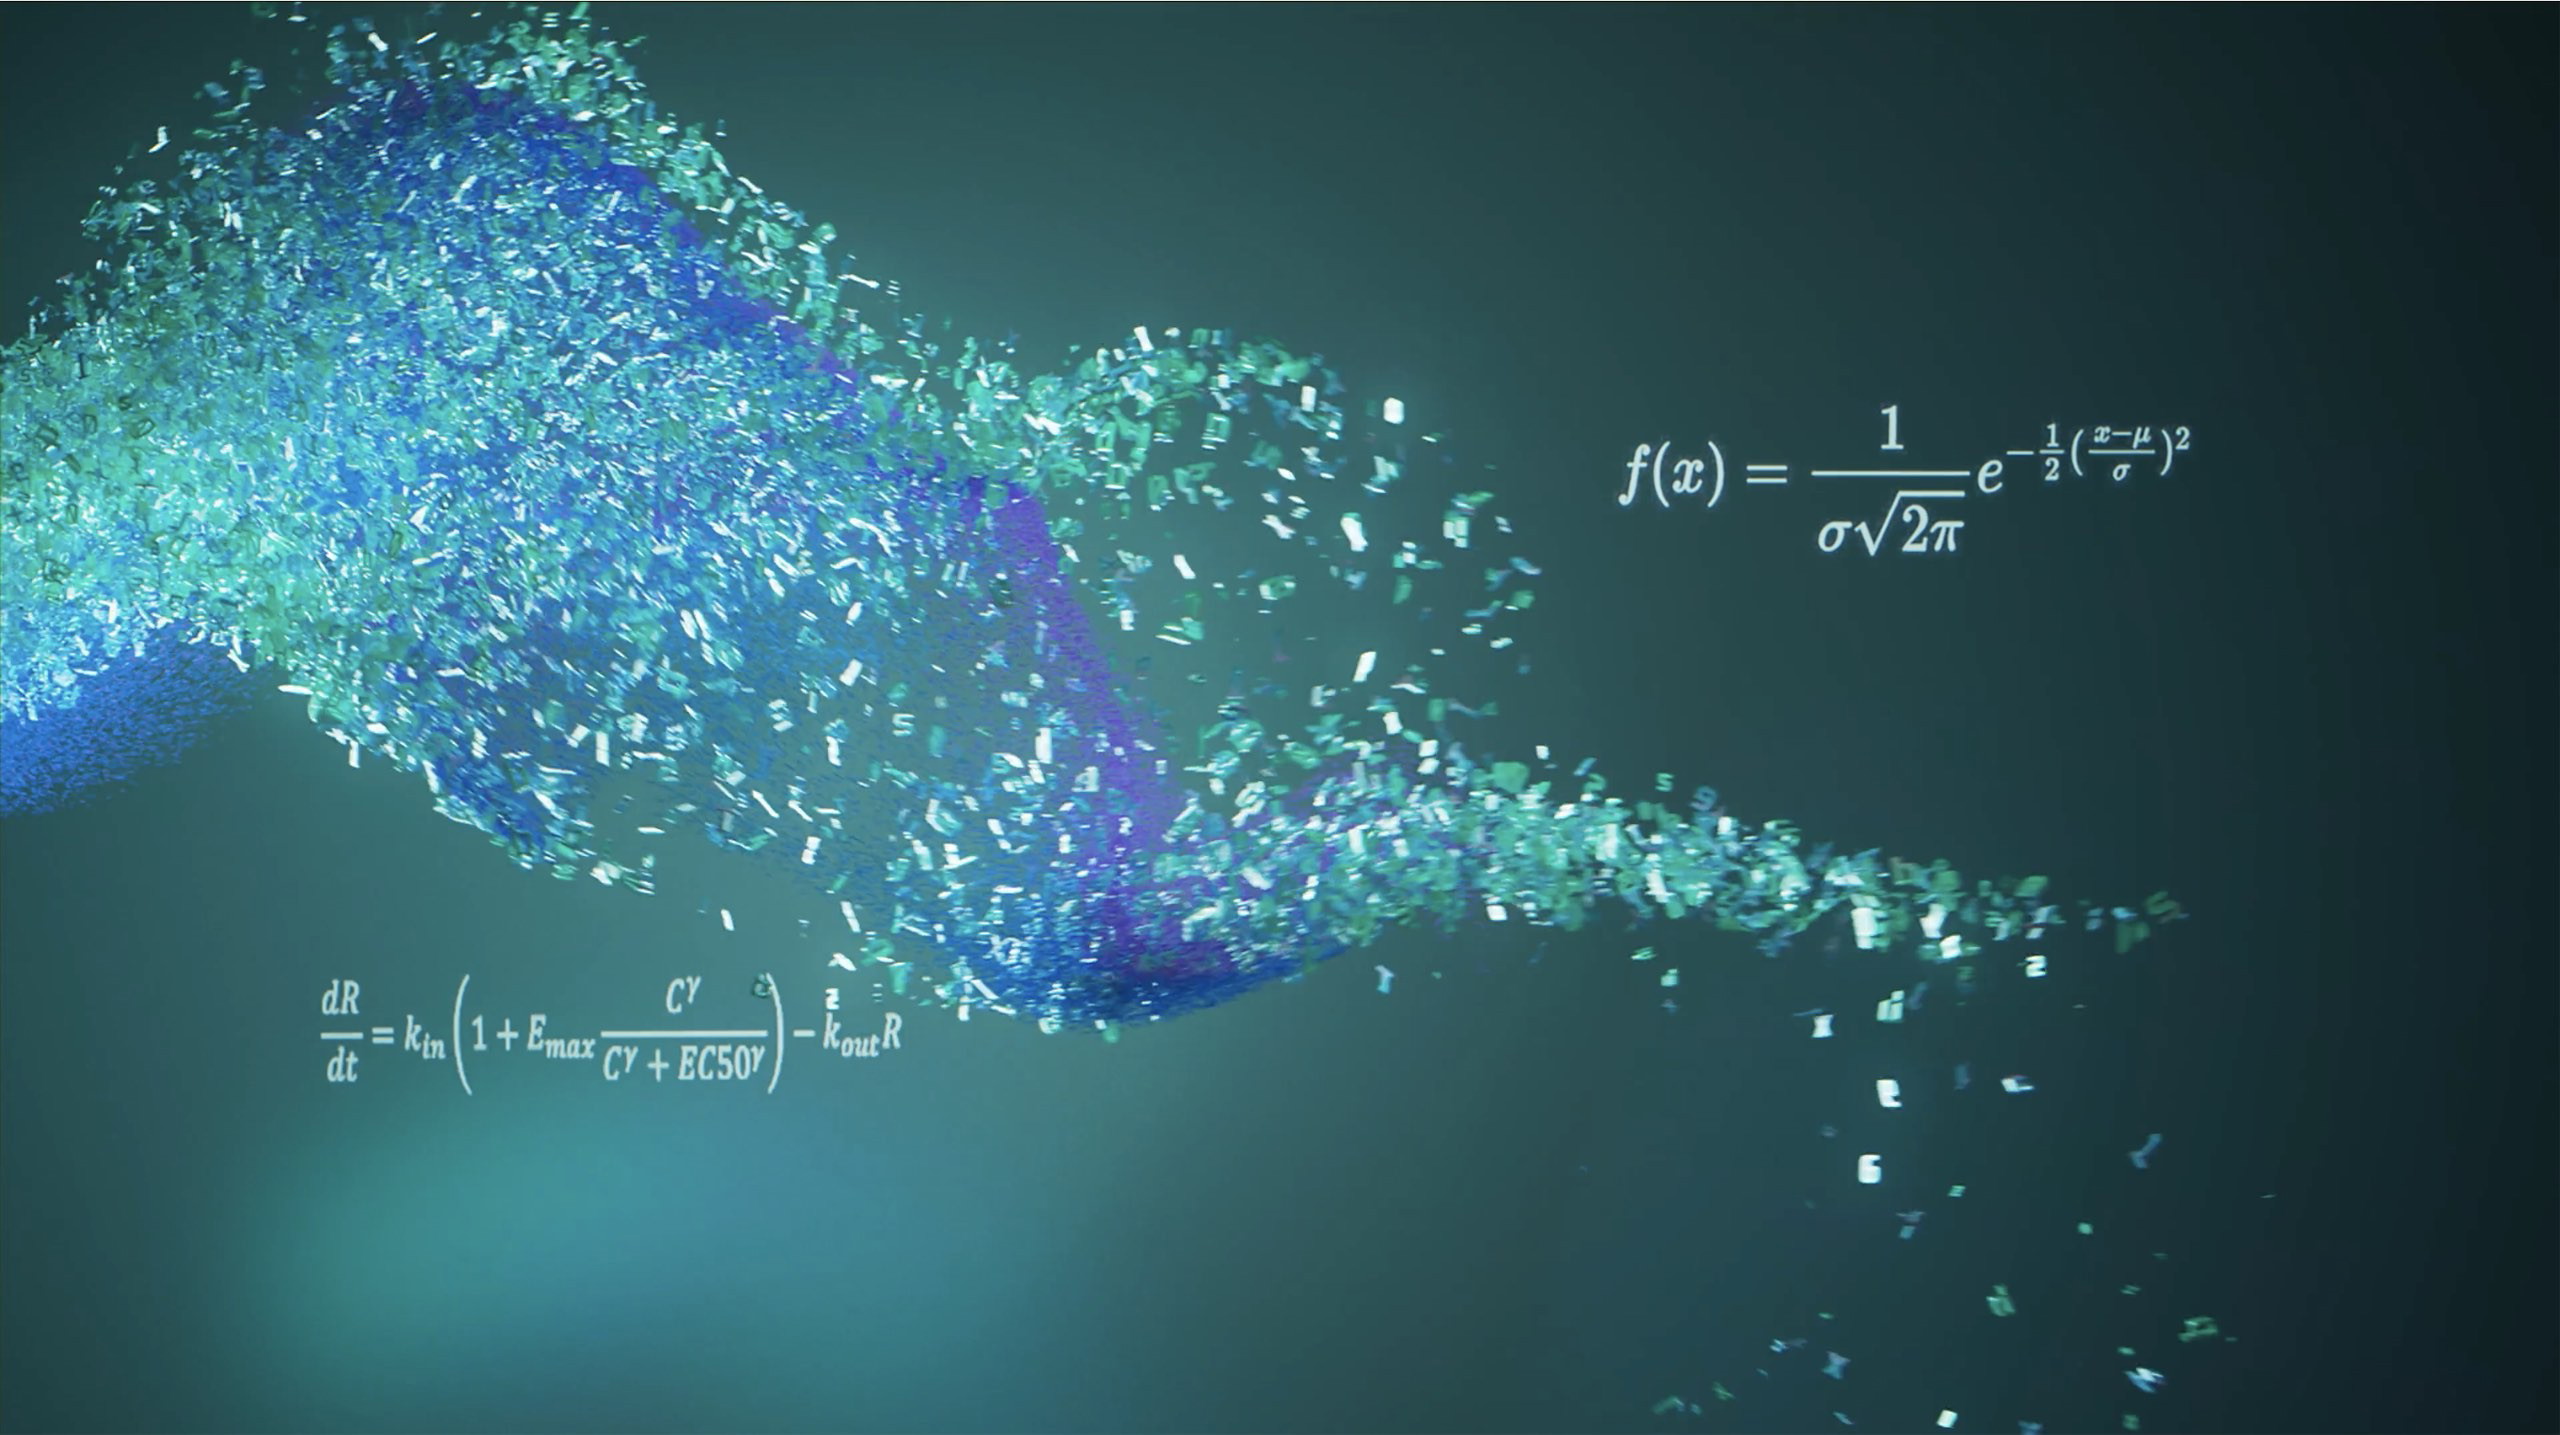
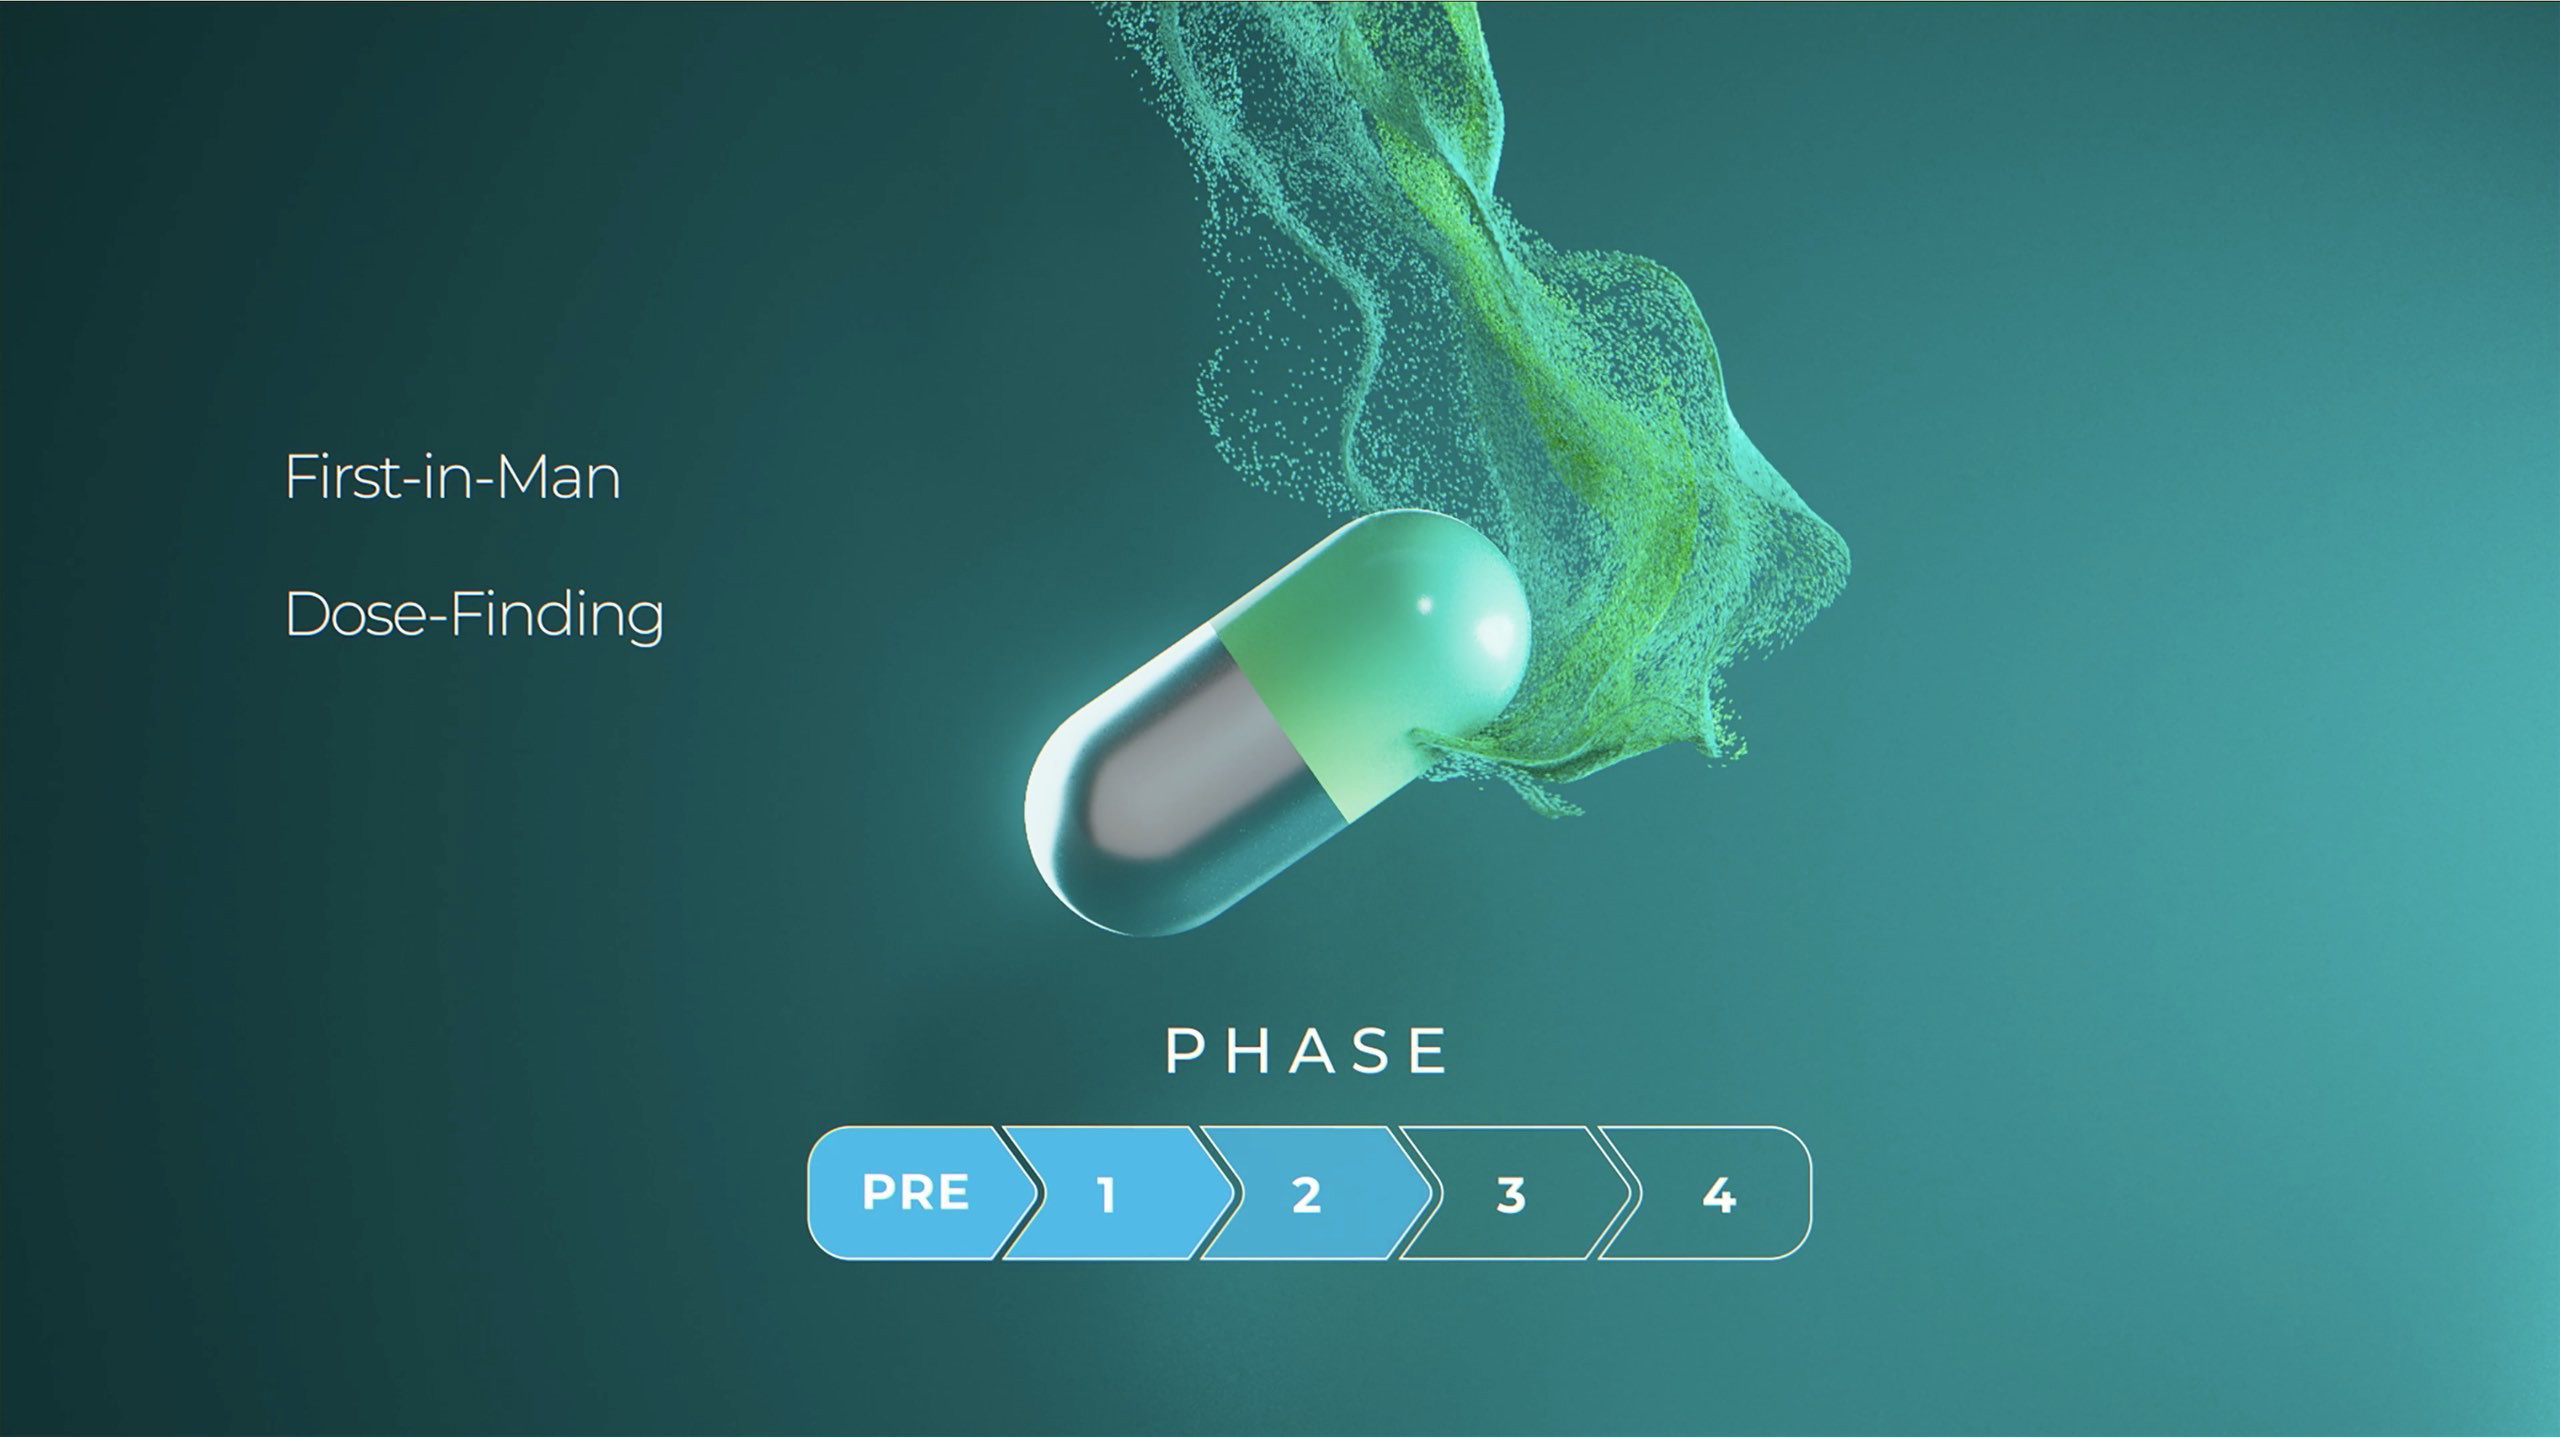
qPharmetra grappled with visually representing their abstract capabilities. We crafted a brand story that aligns with their identity, making their complex skills more accessible. We got to the core of their services, pinning the intricate value they offer to clients. Integrating pharmacological and biological data into engaging visuals, we transformed their expertise into a captivating story for a broad audience.

Ready to make an impact?
Let's explore how our storytelling can drive your success.

Professionalising the brand story
We aimed to communicate qPharmetra's value proposition to potential clients, showcasing how their expertise empowers pharmaceutical companies to make better decisions. This animation served as the first step in professionalising their brand identity and marketing efforts, boasting a high-end aesthetic with a commercial look and feel.

Accelerated production
Our team thrives on challenges. With flexible collaboration and constant client communication, we met the project's tight deadline. This high-paced production intensified our creative process, resulting in a satisfying outcome for all involved.

Using graphs in animation
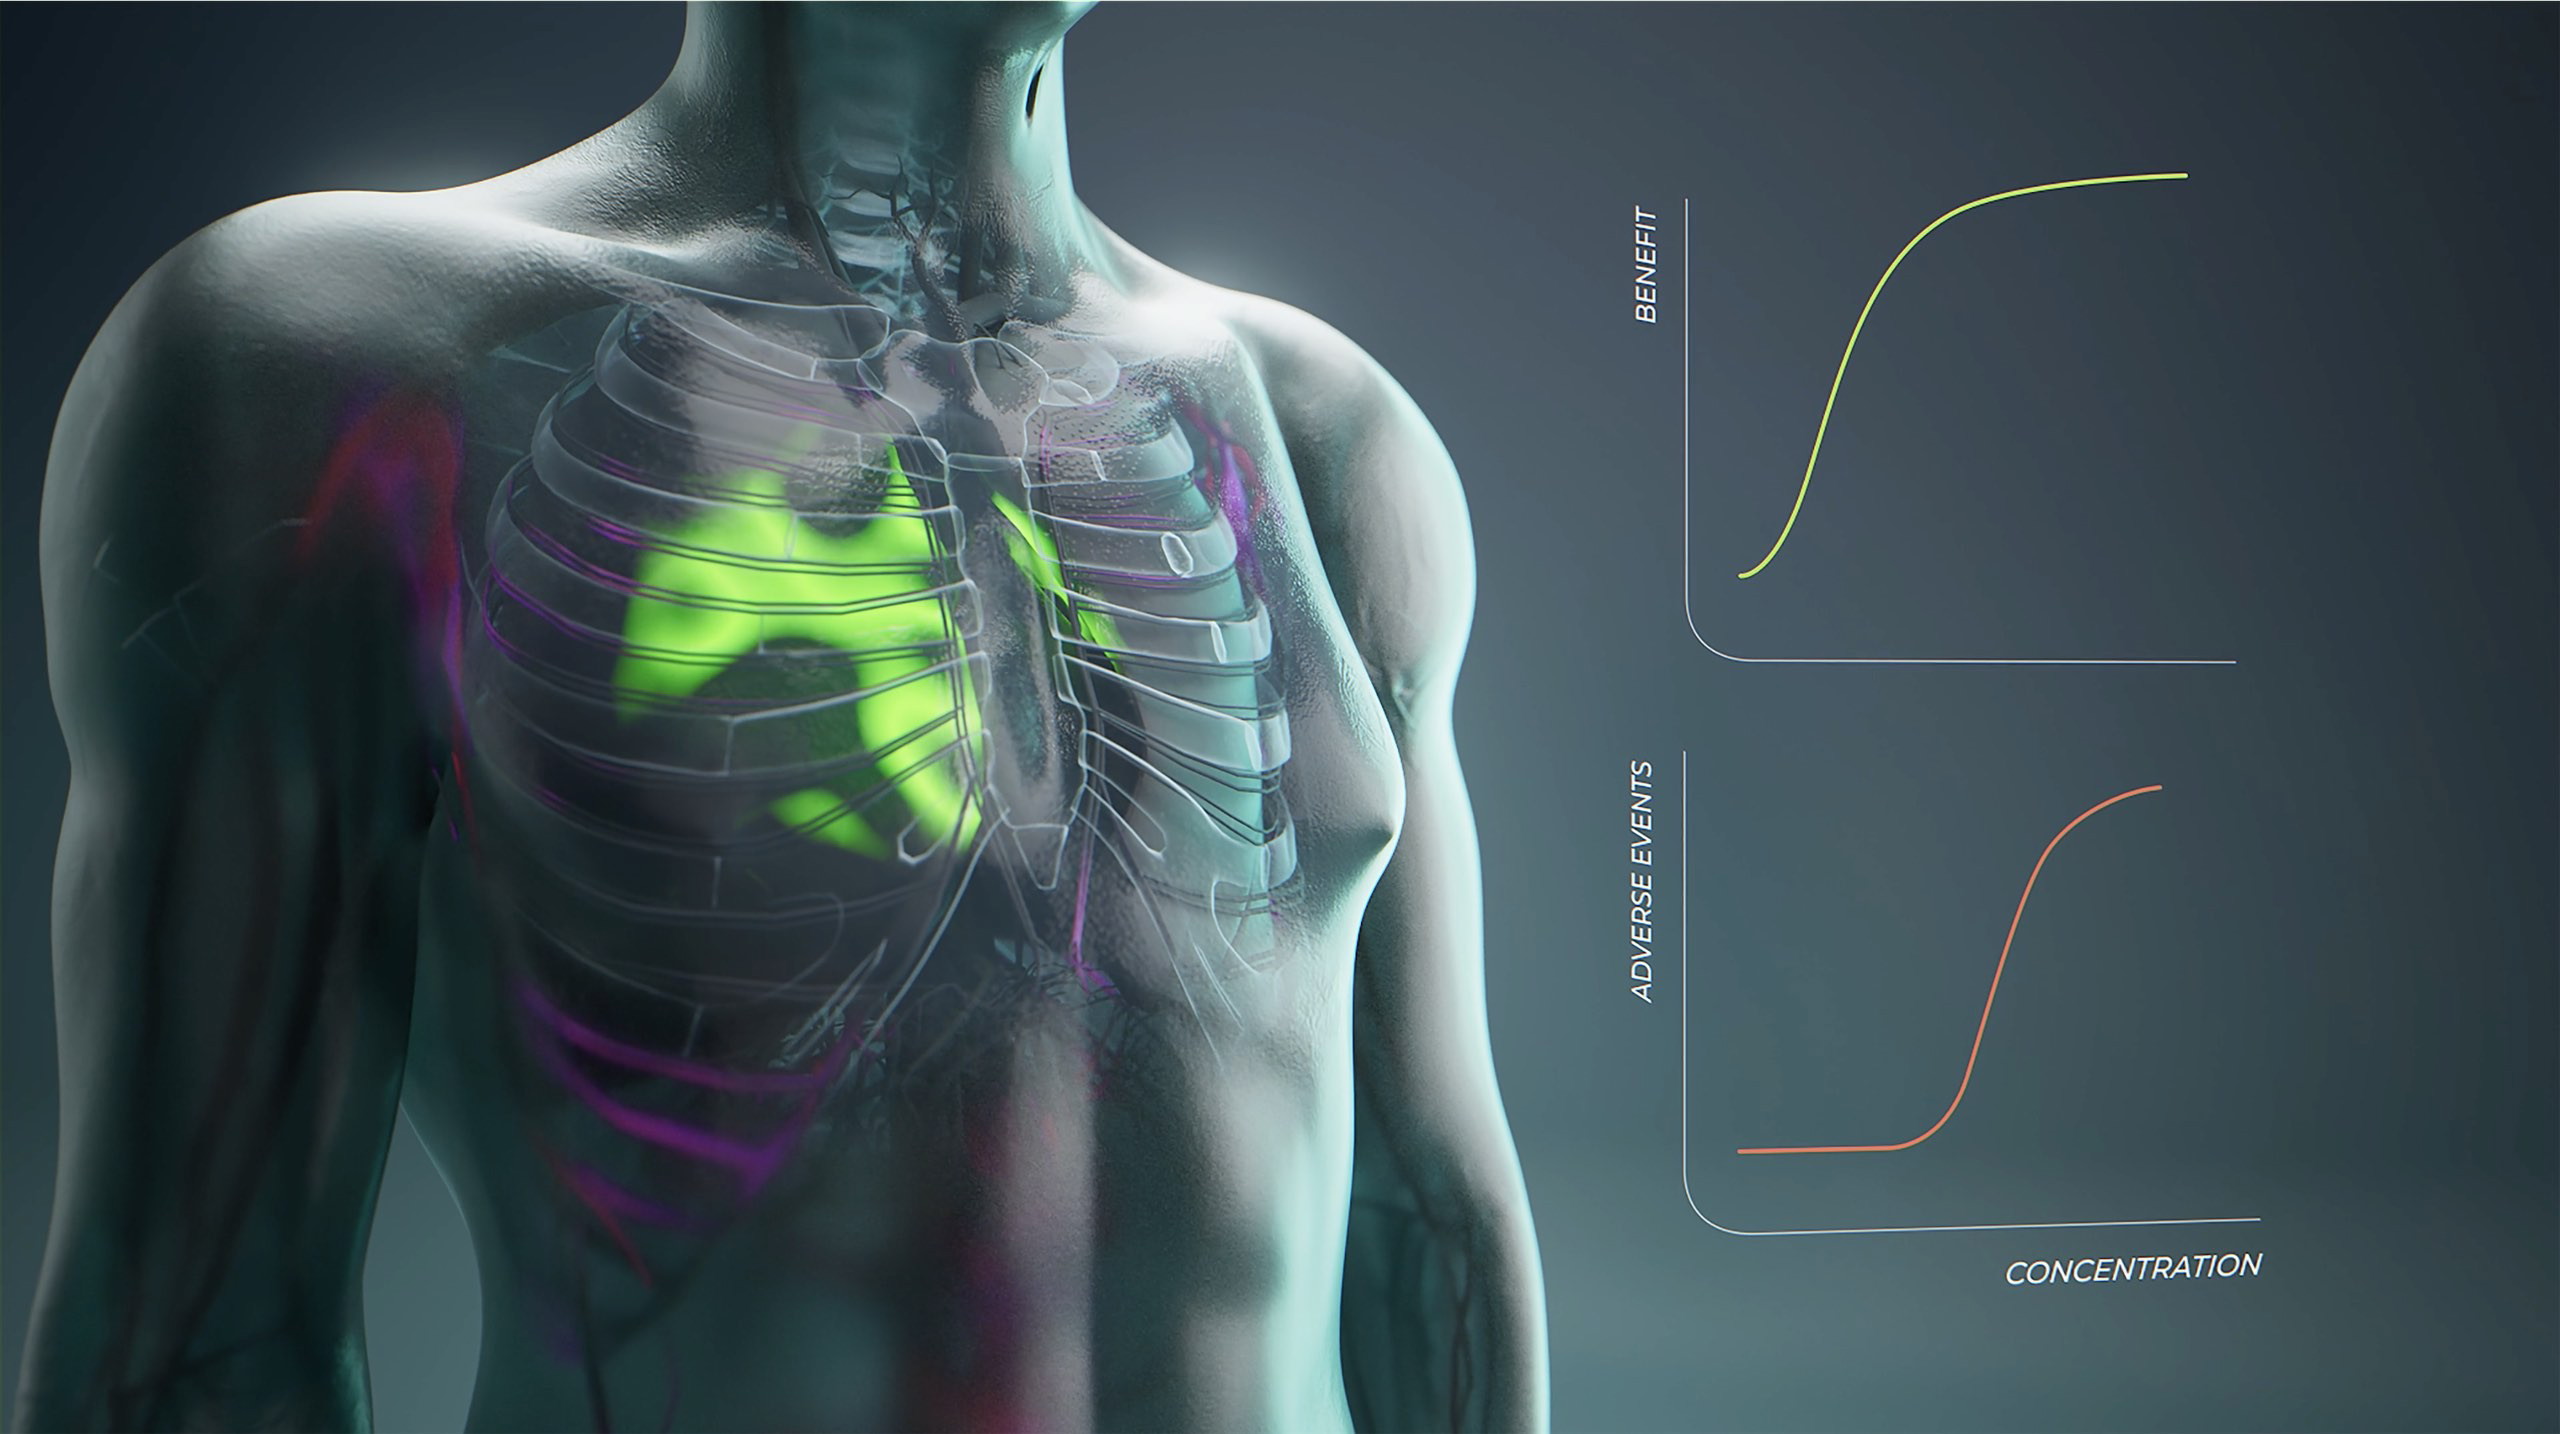
Drug development depends on finding optimal drug exposure levels, balancing efficacy and side effects. qPharmetra's exposure-response models quantify this balance, offering strategic advice to developers. We integrated graphs into the animation, visually showcasing this data's pivotal role.
“Sensu delivered an outstanding cinematic experience to showcase to scientists as well as non-scientists that the exposure-response analysis we provide can support drug development. From the outset, their professionalism, creativity and timely delivery of milestones stood out.”
Max Lagraauw | Consultant



Facing tight deadlines?
Send us a message today, and we’ll find a solution tomorrow.


